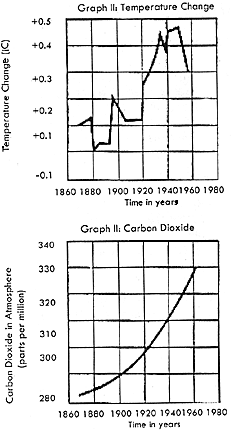
16. According to the diagram at right, which of the following
is the best interpretation of the data in the graphs? The amount of carbon dioxide
in the atmosphere
a. has increased steadily, and the
temperature on the Earth has shown an overall increase.
b. and the temperature on the Earth
have increased at a steady rate.
c. has decreased steadily, and the
temperature on the Earth has shown an overall decrease.
d. has decreased at a steady rate,
causing varying temperatures on the Earth.
 ---------- [Answer] ----------

Slichter

