Using Excel to Calculate the Mean and Standard Deviation of a Set of Trials
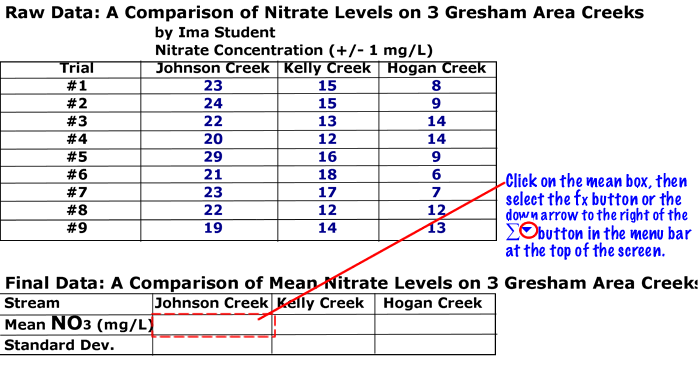
Step One: Set up your data tables so you have a place to add the mean and standard deviation as in the example below. Then click on the mean box shown below and follow the other listed instructions.
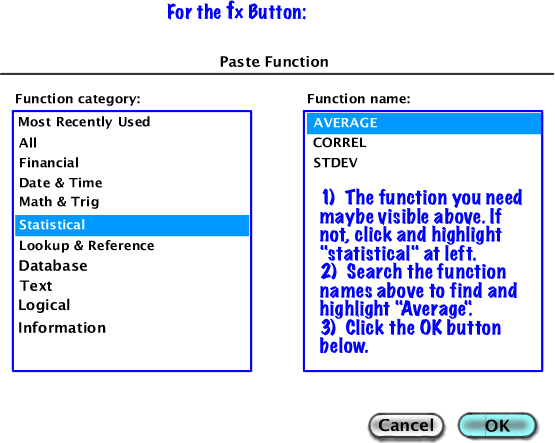
Step Two: Find the "AVERAGE" function and highlight it. Click "OK". (Click each diagram to see it's magnified view.)
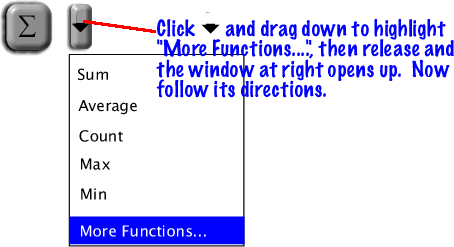 ---Or ----
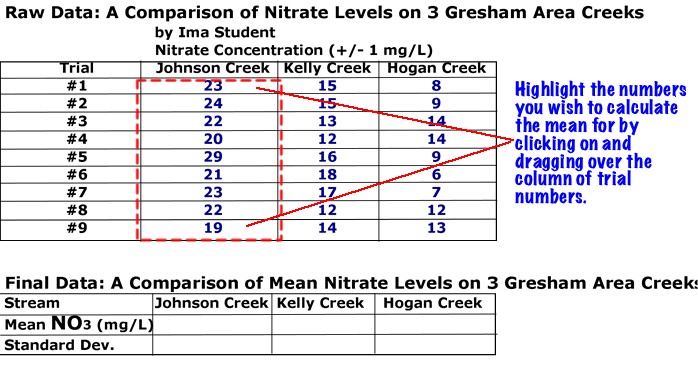
Step Three: Pull the resulting window away from your data table. Then click and drag over the numbers you wish to find the mean for. When done highlighting the numbers, click "OK" on the window you dragged away from your table. The mean should now appear in the mean cell.
Step Four: To find the Standard Deviation of the same data set, click on the standard deviation cell and then go to the fx button in the upper menu of Excel.
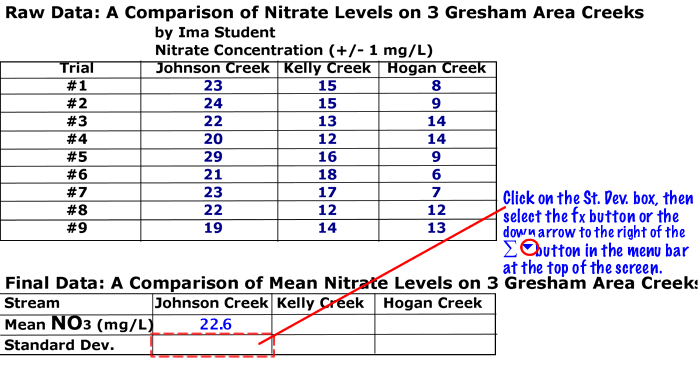
Step Five: Find the "STDEV" function and highlight it. Click "OK".
(Click each diagram to see it's magnified view.)
 ---Or ---
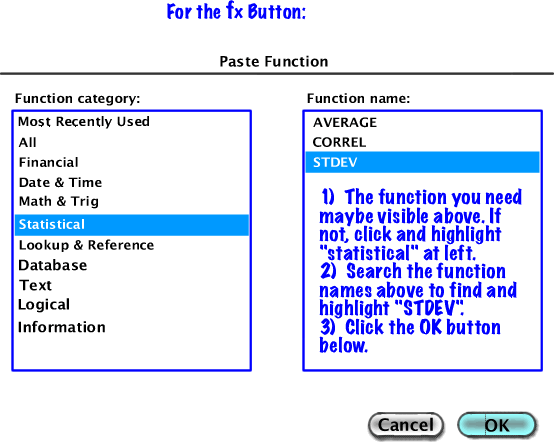
Step Six: Pull the resulting window away from your data table. Then click and drag over the numbers you wish to find the standard deviation for. When done highlighting the numbers, click "OK" on the window you dragged away from your table. The standard deviation should now appear in the standard deivation cell.

Slichter


