
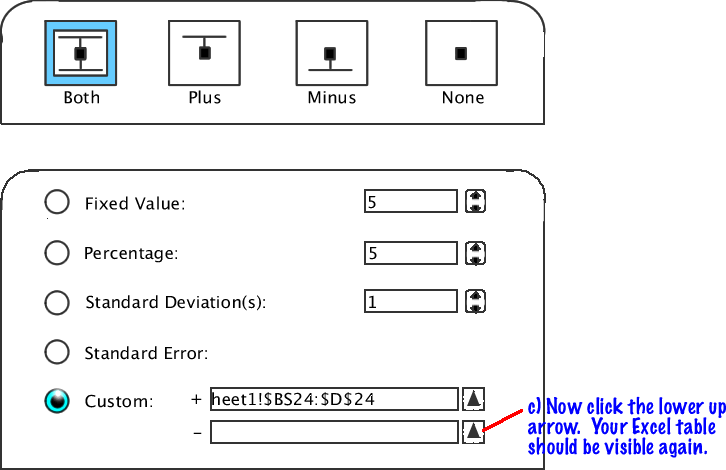
As the Y Error Bar window opens, click the "Both" button.
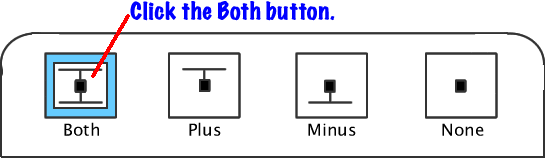
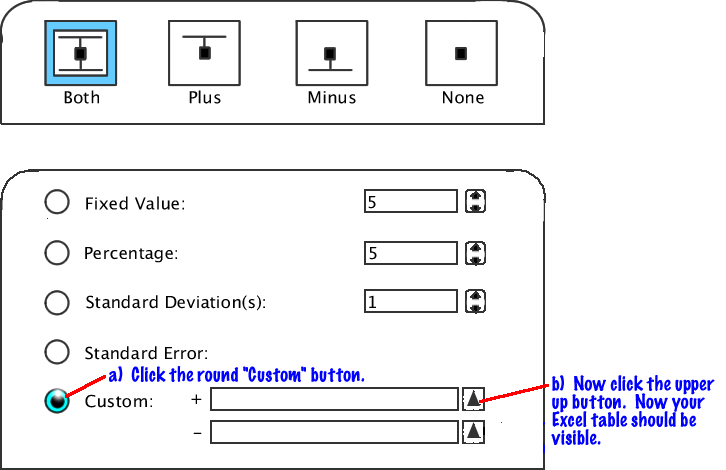
Now your bar or line graph should have Y Error Bars for each bar or point on the graph!

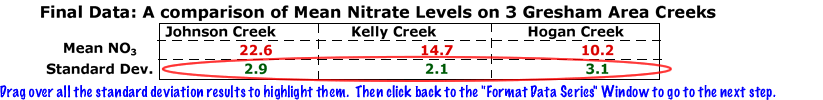
Remember that in reporting results, you want to list the mean plus or minus its standard deviation from the graph. An example would be 70.2 mg/L NO3 +/- 4.6.