Data Preparation & Presentation
A) List formulas or equations used to manipulate data and show an example of how it might be used:
a) Reaction Rate: For each trial, the height of foam in mm was divided by the time (sec) to calcultate the reaction rate per each trial.
b) Average Reaction Rate: For each substrate concentration, the average reaction rate was calculated by adding each of the reaction rates from the 4 trials at that concentration, then dividing by 4. Units were mm/sec.
b) Standard Deviation: Standard deviation was calculated from the reaction rates of the 4 trials at each substrate concentration (See table Below.) These values were input into Microsoft Excel and then calculated by that program.
c) Coefficient of Variance (not used in this example)

The table above is a good representation of the collection of the manipulated data needed to answer this question. It shows the independent variable (% substrate concentration) across the top of the table, with the reaction rates of each trial listed vertically below its corresponding concentration. The average reaction rate and standard deviation for each concentration are also shown. (Note that each average reaction rate has its own standard deviation. Many of you tallied the reaction rates for all the trials of all the concentrations, which resulted in very large standard deviations.) (Calculating standard deviation for the height of foam, or time of foam, although interesting and showing how reliable those data sets are, can't be plotted on a graph representing the question "How substrate concentration affects the reaction rate....". If the question states reaction rate as dependent variable, you need to calculate the standard deviation from the trial reaction rates as seen in the columns above.)
Average Data to be Graphed: How Substrate Concentration Affects the Reaction Rate of Catalase/Peroxide Reactions

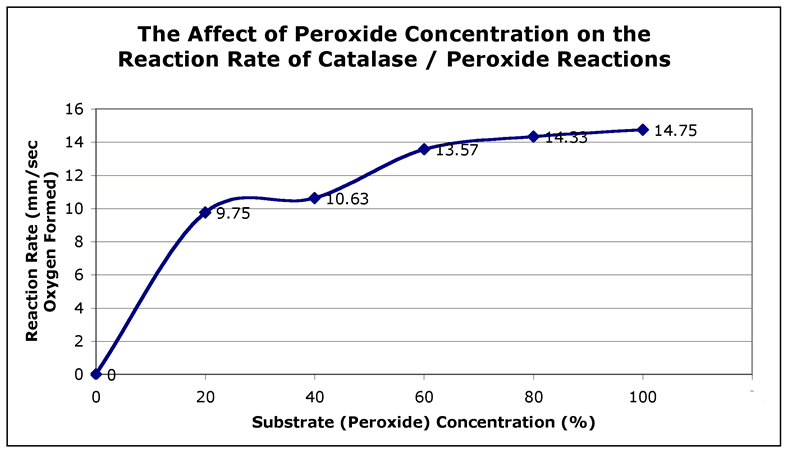
A) Final Graph

The graph above helps answer the question " How do substrate concentration affects the reaction rate of catalase / peroxide reactions?" The independent variable is shown along the X-axis while the dependent variable is shown along the Y-axis. Averaged data is plotted. The title essentially lists the experiment question, but in statement form!
Many of you predicted this would be a linear function, or straight line that continues to rise as substrate concentration raises. This would only occur if the enzyme concentration is very large. In truth, for most of your experiments, the reaction rate leveled off and became fairly constant because as the substrate concentration increases, an increasing number of enzymes become involved. When all the enzymes are involved, the reaction then levels off as some of the increase in substrate must wait for an enzyme to become available to initiate more reaction.
Hint for your graph: Graph only averaged data. What you will be graphing depends upon your question/hypothesis, and thus from the independent & dependent variables. Generally, the independent variable will be placed upon the X-axis and the dependent variable on the Y-axis.[Data Collection for this Experiment] [Conclusion & Analysis for this Experiment]