Coefficient of Variance
The coefficient of variance (CV) measures the precision of the person/s during
a set of individual tests (replicates) performed for one specific water quality
parameter. As an example, if a team has just finished collecting data on 5 replicates
of dissolved oxygen data, the team can use the coefficient of variance formula
to determine how precisely they performed the data. The higher the precision
(the lower the %), the higher the likelihood that
there was no differnce in the way each replicate/ individual test was performed.
In other words, data within a data set which is collected
consistently should hypothetically have a Coefficient of Variance equal to zero
percent!
The value of determining the coefficient of variance is for noting whether
collection of some of the data for a particular water test may have had problems
or not!
Important:
Note that a team can have a low coefficient of variance for a set of data
(say 4% or better) which is highly desirable, and still they may not have accurate
test results. This means that they repeatedly made the
same mistake in collecting data. The team would have to create a graph
comparing the sampled data to the quality control data or they could calculate
percent deviation.
Calculating the Coefficient of Variance

Where s = standard deviation,
and  = mean (average).
You can calculate the CV for the 3-5 replicates for a single
date's sampling.
The following table represents a table of one sample date's turbidity
data compared to the mean:
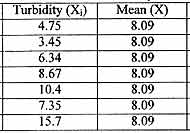
The standard deviation of the turbidity data has been calculated
to be 4.08. When the plugged into the coefficient of variance equation, we find:
CV (4.08 / 8.09) X 100 = 50.43 % .
The precision of the replicates was only 50.43 % which probably
means some of the data could be considered as outliers.
Note:
It helps to collect as much data as you can (usually 5 is a minimum
in serious testing) so that you can eliminate outliers and still have plenty
of data points to average.
Slichter