Standard Deviation
The standard deviation measures the average amount the data deviates from
the average or mean of the data set.

Where:
S = Standard Deviation
Ý = Sum of
 = each data point in a data set
mean = the average of the data points
N = the number of data points.
The data table below represents turbidity data which is being analyzed for
standard deviation. In this case, X represents the mean.
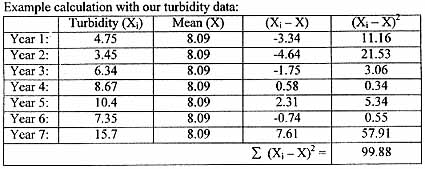
Dividing 99.88 by ( 7-1) , we get a value of 16.65. We then take the square
root of 16.08 which gives us a standard deviation of 4.08. We retain the .08
as the original turbidity data shown in the table above was accurate to 2 decimal
places (as in 4.75, 3.45, etc).
Reporting data results with standard deviation:
The mean turbidity data may be reported as 8.09 +/- 4.08.
The lower the standard deviation, the
greater the precision. In this case, the precision is not very good,
as there is about a 50% variance in the data sets!
[How to Use Standard
Deviation to Compare Data Sets]
[Determining the Standard Deviation using
Excel]
Slichter