If you want a high score, all of the graphs you turn in should be drawn on graph paper or printed from a computer graphing program!
If you want the highest CIM score:
1. All graphs for all assignments in CIM Biology at GHS should be done either on graph paper or on a computer graphing program.
2. You should make your own graph. Copies of other peoples' graphs don't count!
3. All graphs should include a descriptive title (Hint: What does the graph show us?). The title of a graph often is directly related to the experiment title or question!
4. Both the X- and Y- axes should be labeled, each with units where appropriate!
5. If multiple sets of data are present, select data points or colors which show the different data clearly. Provide a key too!
6. Write a sentence to small paragraph below the graph that states what the data shows!
Line graphs work well when both the dependent and independent variables represent numerical data.
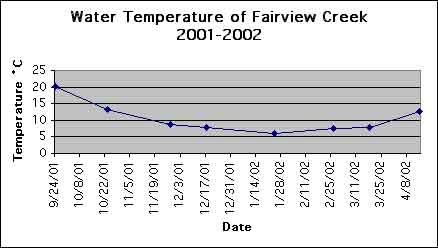
Graph Description: This graph shows how the water temperature of Fairview Creek changed from September 2001 to April 2002. The water temperature dropped from a high of 20¾C in September to a low of 6¾C on January 28, 2002. It slowly raised to a temperature of 13¾C in April 2002.
Bar graphs work well when one of the variables does not involve numbers.
Examples: Car type vs. gas mileage.
Oxygen level vs. stream.
Population vs. country
Graph Description: On March 23, 1953, the Clackamas River had the highest Dissolved Oxygen (DO) at 11 mg/L. Beaver Creek and the Sandy River both were second with a DO of 10 mg/L. Kelly Cr had a DO of 9.5 mg/L, Fairview Cr had a DO of 8.5 mg/L, and Johnson Cr had a DO of 8 mg/L.