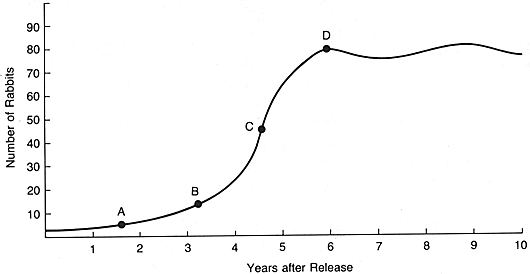
6. The graph below illustrates the rabbit population in a large
field for a number of years after a mating pair was released. Use the graph
to answer the following question.
It took 6 years for the rabbit population
to reach equilibrium at point d, where the population growth levels off.
 ------------ ------------
Slichter