Determining Percent Change of Tabulated Data or Graphed Lines
![]()
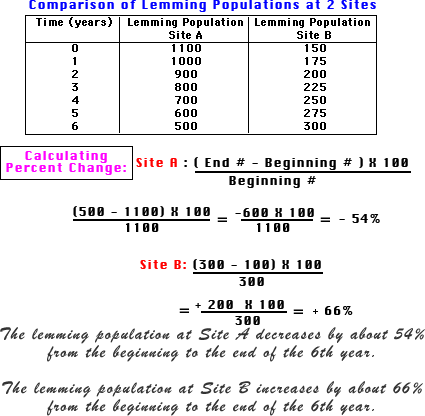
Percent change is used to determine amount of change from beginning to end. It is useful in comparing different data sets where the starting numbers (or total numbers) are not the same, or graphed lines where the slopes of the individual lines are nearly identical. Calculating the percent change allows us to compare how several different sets of numerical data are changing in a numerical way.
