Correlation Coefficient
The correlation coefficient is very useful in determining whether 2 or more
different data sets are related.
You might use this to determine relationships between data representing the
following :
a. pH and streamflow
b. water temperature and streamflow
c. water temperature and dissolved oxygen
d. pH and ammonia concentration
e. nitrate and ammonia concentrations
f. etc........

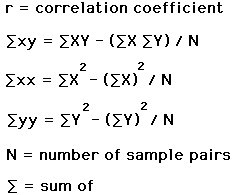
Definitions of Symbols:
Note that there is a differenc between lower case x and y and
the upper case X and Y.

Calculating Correlation Coefficient using
Excel
1. Copy & paste the data you wish to compare into an Excel
spreadsheet.
2. Click the formula button and select the formula: CORREL
(Array1, Array 2)
Where, Array 1= the range of cells for the first set of values
(X) ......
and Array 2 = the range of cells for the second set of values
(Y).
3. Find the level of significance of the result by
a. Count the number of sample pairs, N, you compared.
b. Compare the absolute value (number regardless of positive
or negative) for r with the values in the corresponding row for N.
c. To be significant, the value for r must be equal to or larger
than the value shown in the table.
[Levels of Significance Table]
What does the correlation coefficient, r, value mean? The value
for r is always between -1.00 and +1.00. For values that are positive there
is a positive correlation, meaning that the two variables vary in the same direction
(i.e. as X increases Y increases, or as x decreases Y decreases). For values
that are negative there is a negative correlation, meaning that the two values
vary in opposite directions (i.e., as X increases Y decreases, or as X decreases
Y increases). For example, as water temperature increases dissolved oxygen decreases.
The closer to 1.00 the value for r is, the greater the correlation.
So, at +1.00 there is a perfect positive correlation, and at -1.00 there is
a perfect negative correlation. At 0.00 there is no correlation between the
two variables. If the value is greater than 0.50 in either the positive or negative
direction, there is likely a significant correlation between the two variables.
The
Slichter
![]()