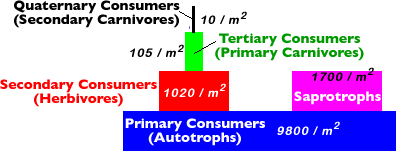

Pyramid of Numbers: Graphical way of showing the relative amounts of energy found in each trophic level of a food chain.

In this type of pyramid, the autotrophs (plants) would typically have the highest number of organisms with each level above it containing roughly 90% less. However, it is possible that if the autotrophs are very large in size in relation to the herbivores that eat them, then the autotrophs may have fewer numbers than the total number of herbivores (See example near bottom of page.).
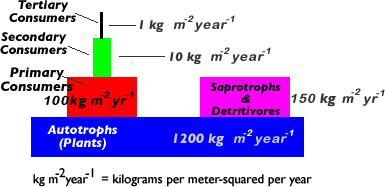
Pyramid of Biomass: Graphical way of showing the relative amounts of biomass found in each trophic level of a food chain. Biomass is the total dry mass of organic matter found in organisms or ecosystems.

* In this type of pyramid, the autotrophs (plants) should have the highest amount of biomass, and each level above that should also be less. The biomass is measured as dry mass to eliminate any variable having to do with differing levels of moisture in the samples being measured!
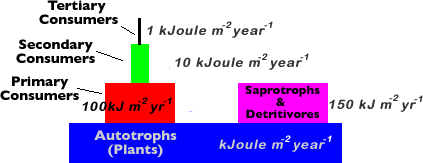
Pyramid of Energy: Graphical way of showing the relative amounts of energy to be found in each trophic level.

Note that the amount of energy in each trophic level always decreases moving upwards on the pyramid from autotrophs to primary consumer, then to secondary consumer, etc. This occurs because roughly 90% of the energy is lost as heat, motion, etc. before it can be given to the next level.
* In this pyramid, the autotrophs (plants) should have the highest amount of biomass, and each level above that should also be less.
A) Why do the primary consumers contain less than 10% of the energy contained by the producers?

Note: On the energy pyramid shown above, which is based on a marine ecosystem, where the producers are microscopic plankton, much less than 10% of the energy found in the producers is transferred to the primary consumers (only about 5% is transferred). Why does this occur? ...........It turns out that the plankton are short-lived. Many die of natural causes before their energy can be transferred to the primary consumers. The saprotrophs and detritivores thus gain a large amount of energy from these dead producers as a result!
Sources of energy loss between trophic levels(or why there is up to 90% energy loss):
a) Energy lost as heat.
b) Wastes contain energy which never make it to higher levels (although will pass to the saprotrophs).
c) The energy found in hair, bones and undigestable plant parts may not be eaten or digested completely.
d) Some organisms die before they can be eaten by a creature in a trophic level above them.
