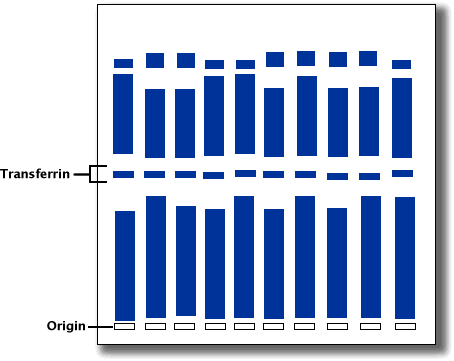
18. The diagram below shows the results of a DNA profile of a population of endangered cheetahs. Blood samples from 10 cheetahs were obtained and analyzed for the protein transferrin using gel electrophoresis. The bands on the gel that represent the alleles for transferrin are indicated.
How many of the cheetahs in this population are heterozygous?


