also known as
DNA Fingerprinting
DNA profiles can also use electrophoresis to identify genetic variation within a population. In other words, how inbred is the population? This is especially useful for looking at populations of endangered animals, such as the cheetah.
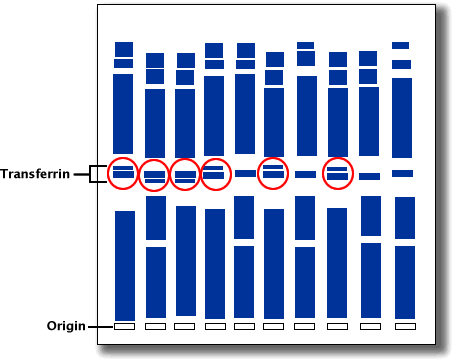
The diagram below represents an electrophoresis gel of a population of cats. The alleles for the gene that makes the protein transferrin is shown at the middle of the bands. A population of 10 cats is shown.
Those cats with two alleles have 2 bands for transferrin. These are highlighted below with red circles. These cats have more genetic variation because they are heterozygous for transferrin.
The 4 cats with only one band (not circled) have only one allele for transferrin. They are thus homozygous for transferrin and more likely to be inbred.


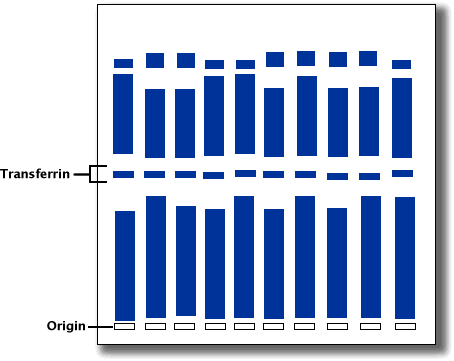
The population is most likely to be inbred as each of the 10 cheetahs studied has only one allele (one thin blue band) for the gene for transferrin. They are thus all homozygous for transferrin.